The Decision Leadership Needed
The product is a B2C, feed-based application where user engagement directly impacts retention and long-term revenue. Engagement is closely monitored by leadership and often used as an early warning signal for product regressions.
Shortly after the gradual rollout of a new feed experience, leadership observed a sustained decline in engagement. The timing raised immediate concern that the feature had negatively impacted user behavior. The decision at stake was whether to rollback the feature, pause further rollout, or continue with targeted iteration.
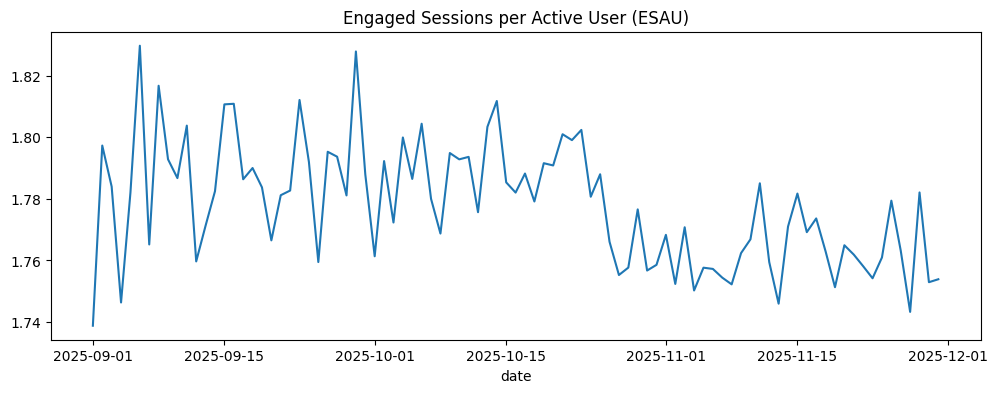
Figure 1: Daily Engaged Sessions per Active User (ESAU). Engagement trends downward after feature rollout, triggering executive concern.
The Data Behind the Decision
To determine whether the feed update caused the drop,
the analysis required visibility into baseline quality,
feature exposure, and post-launch behavior.
User-level context
User records capture who users were before the rollout.
- Signup timing and acquisition channel
- Cohort quality classification
- Returning vs new user status
This answers: what kind of users are we observing?
Behavioral outcomes
Event-level data tracks actual engagement over time.
- Session starts and counts
- Feature exposure flags
- Pre vs post indicators
This answers: how behavior changed after exposure.
Early warning signs
Feature exposure was correlated with baseline engagement,
and total sessions continued to grow even as ESAU declined,
a classic signal of cohort-driven metric movement.
Because baseline quality and post-launch behavior were observable separately,
the analysis could isolate product impact
from population drift.
The Standard Analysis (What Most Teams Would Do)
The initial evidence appeared to point clearly toward a rollback.
Following the conventional analytics playbook, the analysis began with
aggregate comparisons that most teams rely on under time pressure.
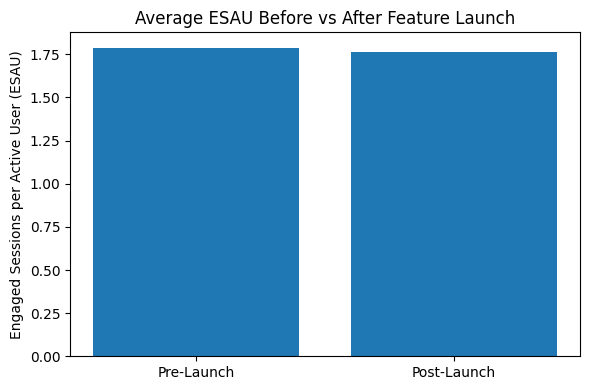
Step 1: Pre / post comparison
ESAU was compared before and after the feed rollout across the full user base.
Fast, intuitive, and commonly used in production monitoring.
Step 2: Treated vs control trends
Users exposed to the new feed were compared against non-exposed users
over the same time window.
Assumes exposure is exogenous.
Step 3: Difference-in-Differences
A DiD model estimated the interaction between feature exposure
and the post-launch period.
Statistically rigorous, if assumptions hold.
All three views told the same story.
ESAU declined immediately following rollout, suggesting a negative feature impact.
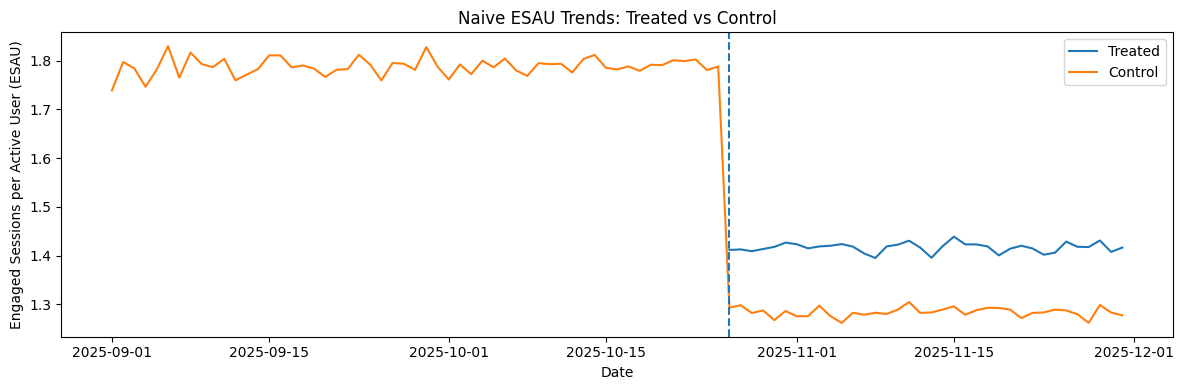
Exposed users diverged downward relative to controls, reinforcing the rollback narrative.
Naive conclusion
The feed update caused the engagement drop.
Rolling back would restore performance.
Agentic Investigation: Structuring the Root Cause Analysis
Before applying deeper causal methods,
the challenge was not computation,
but deciding what to test and in what order
under time pressure.
To avoid anchoring on the most visible explanation (the feature),
I designed an agentic investigation framework
that systematically evaluated competing hypotheses
behind the engagement decline.
Hypothesis generation
- Feature regression from the new feed
- Seasonality and calendar effects
- User quality and acquisition mix shift
- Instrumentation or logging issues
Prevents premature fixation on a single narrative.
Agent-driven test planning
The agent ranked hypotheses by plausibility,
expected impact, and cost of validation,
then selected appropriate analytical tests.
- Cohort stability checks
- Pre/post balance diagnostics
- Segment-level trend analysis
- Causal estimation where warranted
Evidence synthesis
Results from each test were summarized
and evaluated jointly rather than in isolation.
Avoids overreacting to statistically significant
but economically misleading signals.
Why this mattered
The agentic layer ensured the analysis remained
hypothesis-driven rather than metric-driven,
narrowing the root cause before applying
Difference-in-Differences and matching.
My Approach: Estimating the Counterfactual
The critical question was not whether engagement changed,
but what would have happened without the feed update.
Because exposure to the feature was non-random,
the counterfactual could not be observed directly.
The analysis therefore focused on constructing a defensible
approximation using only pre-rollout information.
Freeze pre-treatment behavior
User features were engineered exclusively from behavior observed
before the rollout.
Prevents post-treatment leakage.
Model exposure propensity
A propensity model estimated each user’s likelihood of receiving
the new feed based on baseline engagement and lifecycle stage.
Makes selection bias explicit.
Match comparable users
Treated users were matched to control users
with similar propensity scores.
Approximates a randomized experiment.
Engagement outcomes were then compared over the full post period,
avoiding unstable daily ratios that exaggerate noise.
Matching is only valid if treated and control users overlap.
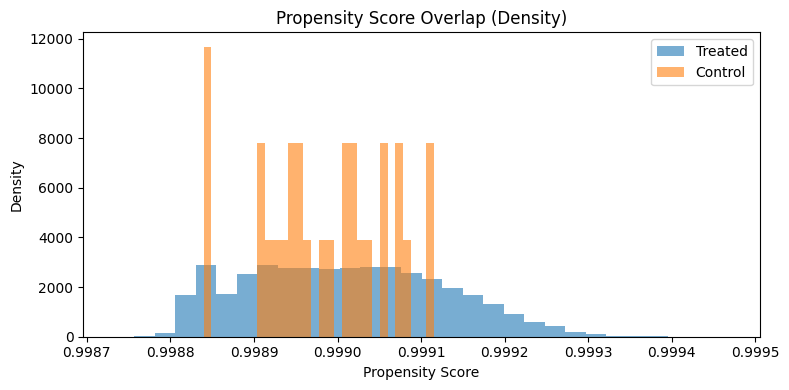
Propensity score distributions show sufficient overlap after trimming,
validating the matching approach.
What this enabled
By comparing users who looked similar before exposure,
the analysis isolated the feature’s interaction effect
from cohort shifts and seasonality.
What Changed After Correcting for Bias
Once selection effects and cohort shifts were accounted for,
the story changed.
The naive view suggested a clear regression:
ESAU dropped immediately after rollout.
That conclusion was incomplete.
It attributed all movement to the feature,
ignoring who entered and exited the metric.
Naive interpretation
- ~1.45% ESAU decline post-launch
- Statistically significant pre/post difference
- Treated users trend downward
Comparison contaminated by selection bias.
Bias-corrected view
- ~14.8% fewer sessions for treated users vs matched controls
- Effect real, but economically modest
- Insufficient to explain aggregate decline
Comparison now reflects like-for-like users.
Decision implication
The feature contributed marginally to the drop,
but rolling it back would not have recovered engagement.
The dominant drivers were cohort quality and seasonality.