The Decision That Triggered This Analysis
Growth was accelerating, but leadership needed to know whether it was healthy.
The product monetizes through ads and subscriptions, making long-term retention
more valuable than short-term conversion spikes.
The question wasn't whether to grow; it was whether growth was coming from users
who would stay.
The Data Behind the Decision
To separate user quality from feature impact,
the analysis required data that captured behavior before and after
exposure, at the right level of granularity.
User-level context
Each user record represents a single acquisition outcome with enough
historical signal to estimate baseline quality.
- Engagement segment (low / core / power)
- Signup channel and timestamp
- Pre-exposure engagement score
- 7-day retention outcome
This table answers: who are these users before we touch them?
Session-level behavior
Event data captures how users actually interact once acquired,
allowing engagement and retention to be measured independently.
- Session boundaries
- Card view events per session
- Temporal ordering of interactions
This table answers: what do users actually do after arrival?
Critical signal surfaced
Users acquired through certain channels had systematically higher baseline engagement even before exposure.
This confirmed strong selection bias and invalidated
naive engagement comparisons.
Because baseline quality and post-acquisition behavior were observable
in separate but linkable tables, the analysis could explicitly control
for user mix, isolating what the channel caused
from who the channel happened to attract.
Why ROI-Based Allocation Fails at Scale
ROI works early.
It fails precisely when growth starts to matter.
At small budgets, ranking channels by ROI feels reasonable.
Spend is limited, audiences are fresh, and most channels appear efficient.
This creates a dangerous illusion: that efficiency scales.
The hidden assumption
ROI assumes that marginal users look like average users, and that
conversions are both causal and equally valuable.
In practice, none of these assumptions hold. As spend increases:
- High-ROI channels increasingly convert users who would have converted anyway
- User quality deteriorates as easy wins are exhausted
- Incremental value saturates long before spend does
If ROI were a reliable proxy for value, channels with the highest ROI
would also dominate on incremental LTV.
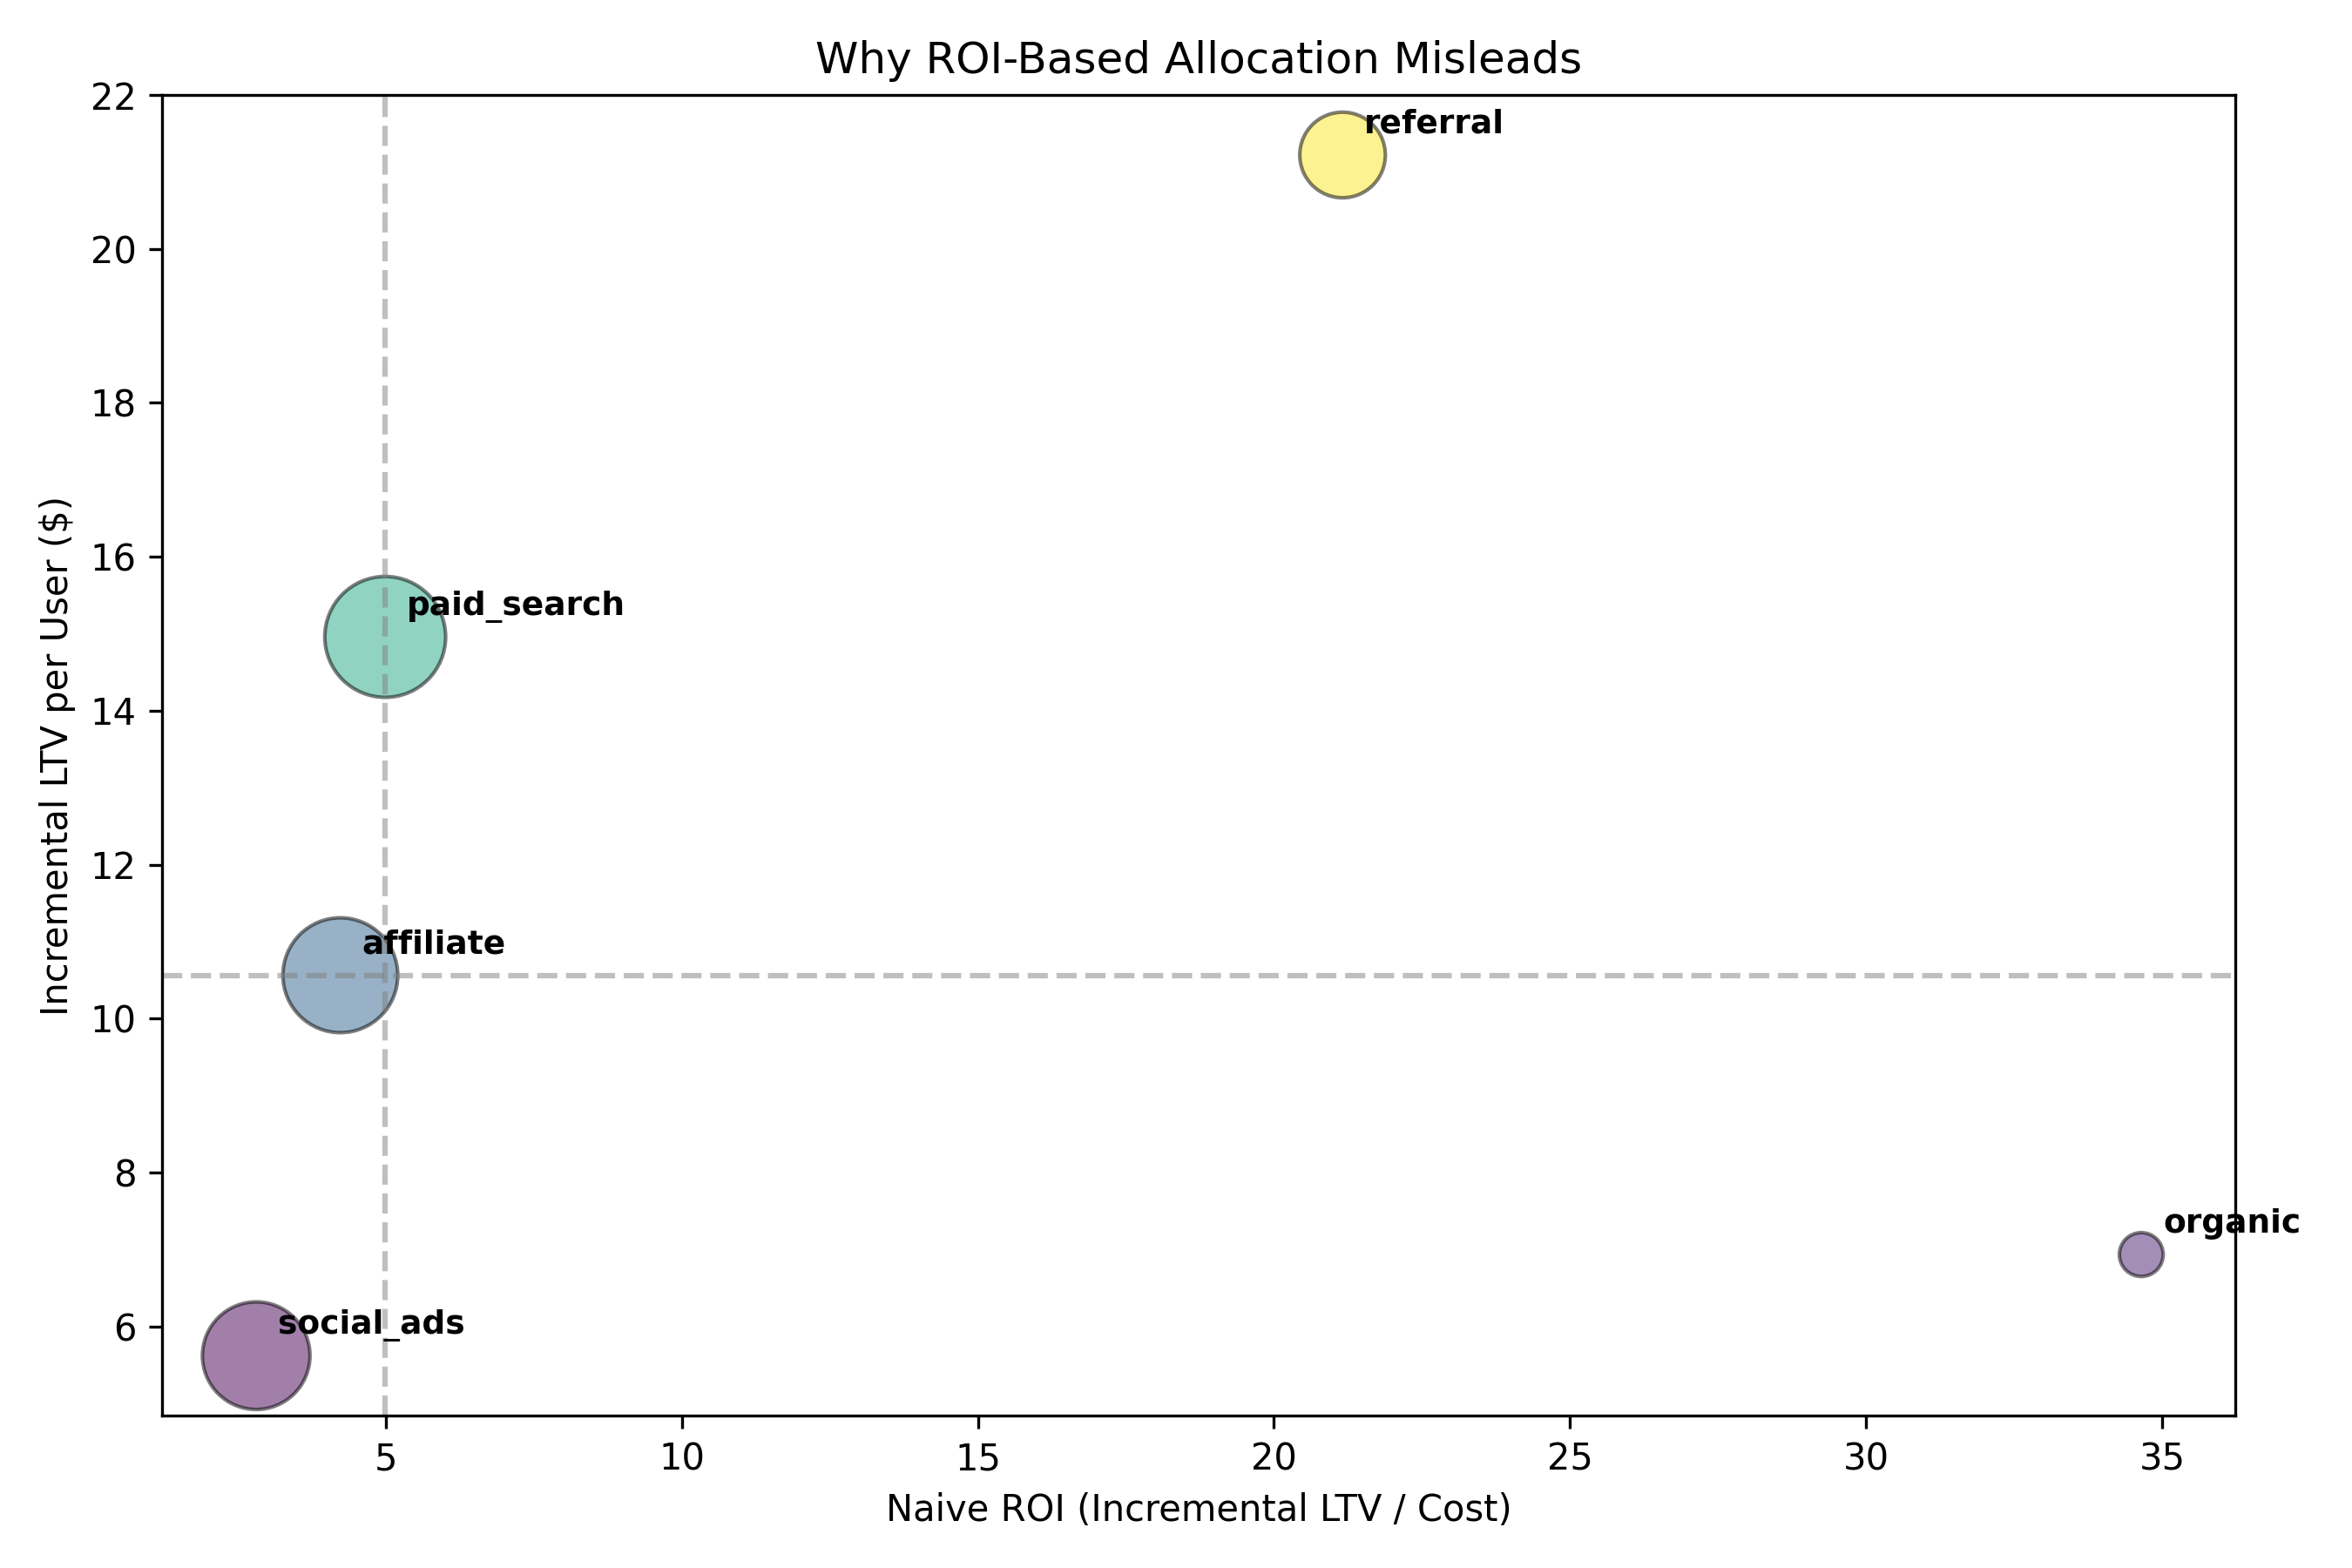
Each point represents a channel.
If ROI tracked causal value, points would lie along a diagonal.
Instead, the relationship breaks, exposing hidden tradeoffs.
What the chart reveals
Several high-ROI channels underperform on incremental LTV,
while channels that look inefficient on paper create
substantially more long-term value.
This is the failure mode of ROI at scale:
it rewards channels that harvest existing demand,
not those that create durable growth.
What Changed After Correcting for Bias
Once user quality and selection effects were controlled for,
the channel rankings changed dramatically.
Before correction, ROI-based views suggested a familiar story:
organic and paid search appeared efficient,
while referral looked constrained by volume.
That story was wrong.
It reflected who channels attracted,
not what value they actually created.
Before correction
Channels ranked by surface efficiency.
- Organic and paid search dominate due to low cost
- Referral appears secondary due to limited scale
- Social ads look viable on conversion throughput
Bias source: high-quality users were unevenly distributed across channels.
After correction
Channels ranked by incremental LTV.
- Referral emerges as the strongest causal driver of value
- Paid search underperforms once saturation is accounted for
- Organic loses its dominance when “free” ≠ “incremental”
Bias removed: comparisons now reflect like-for-like users.
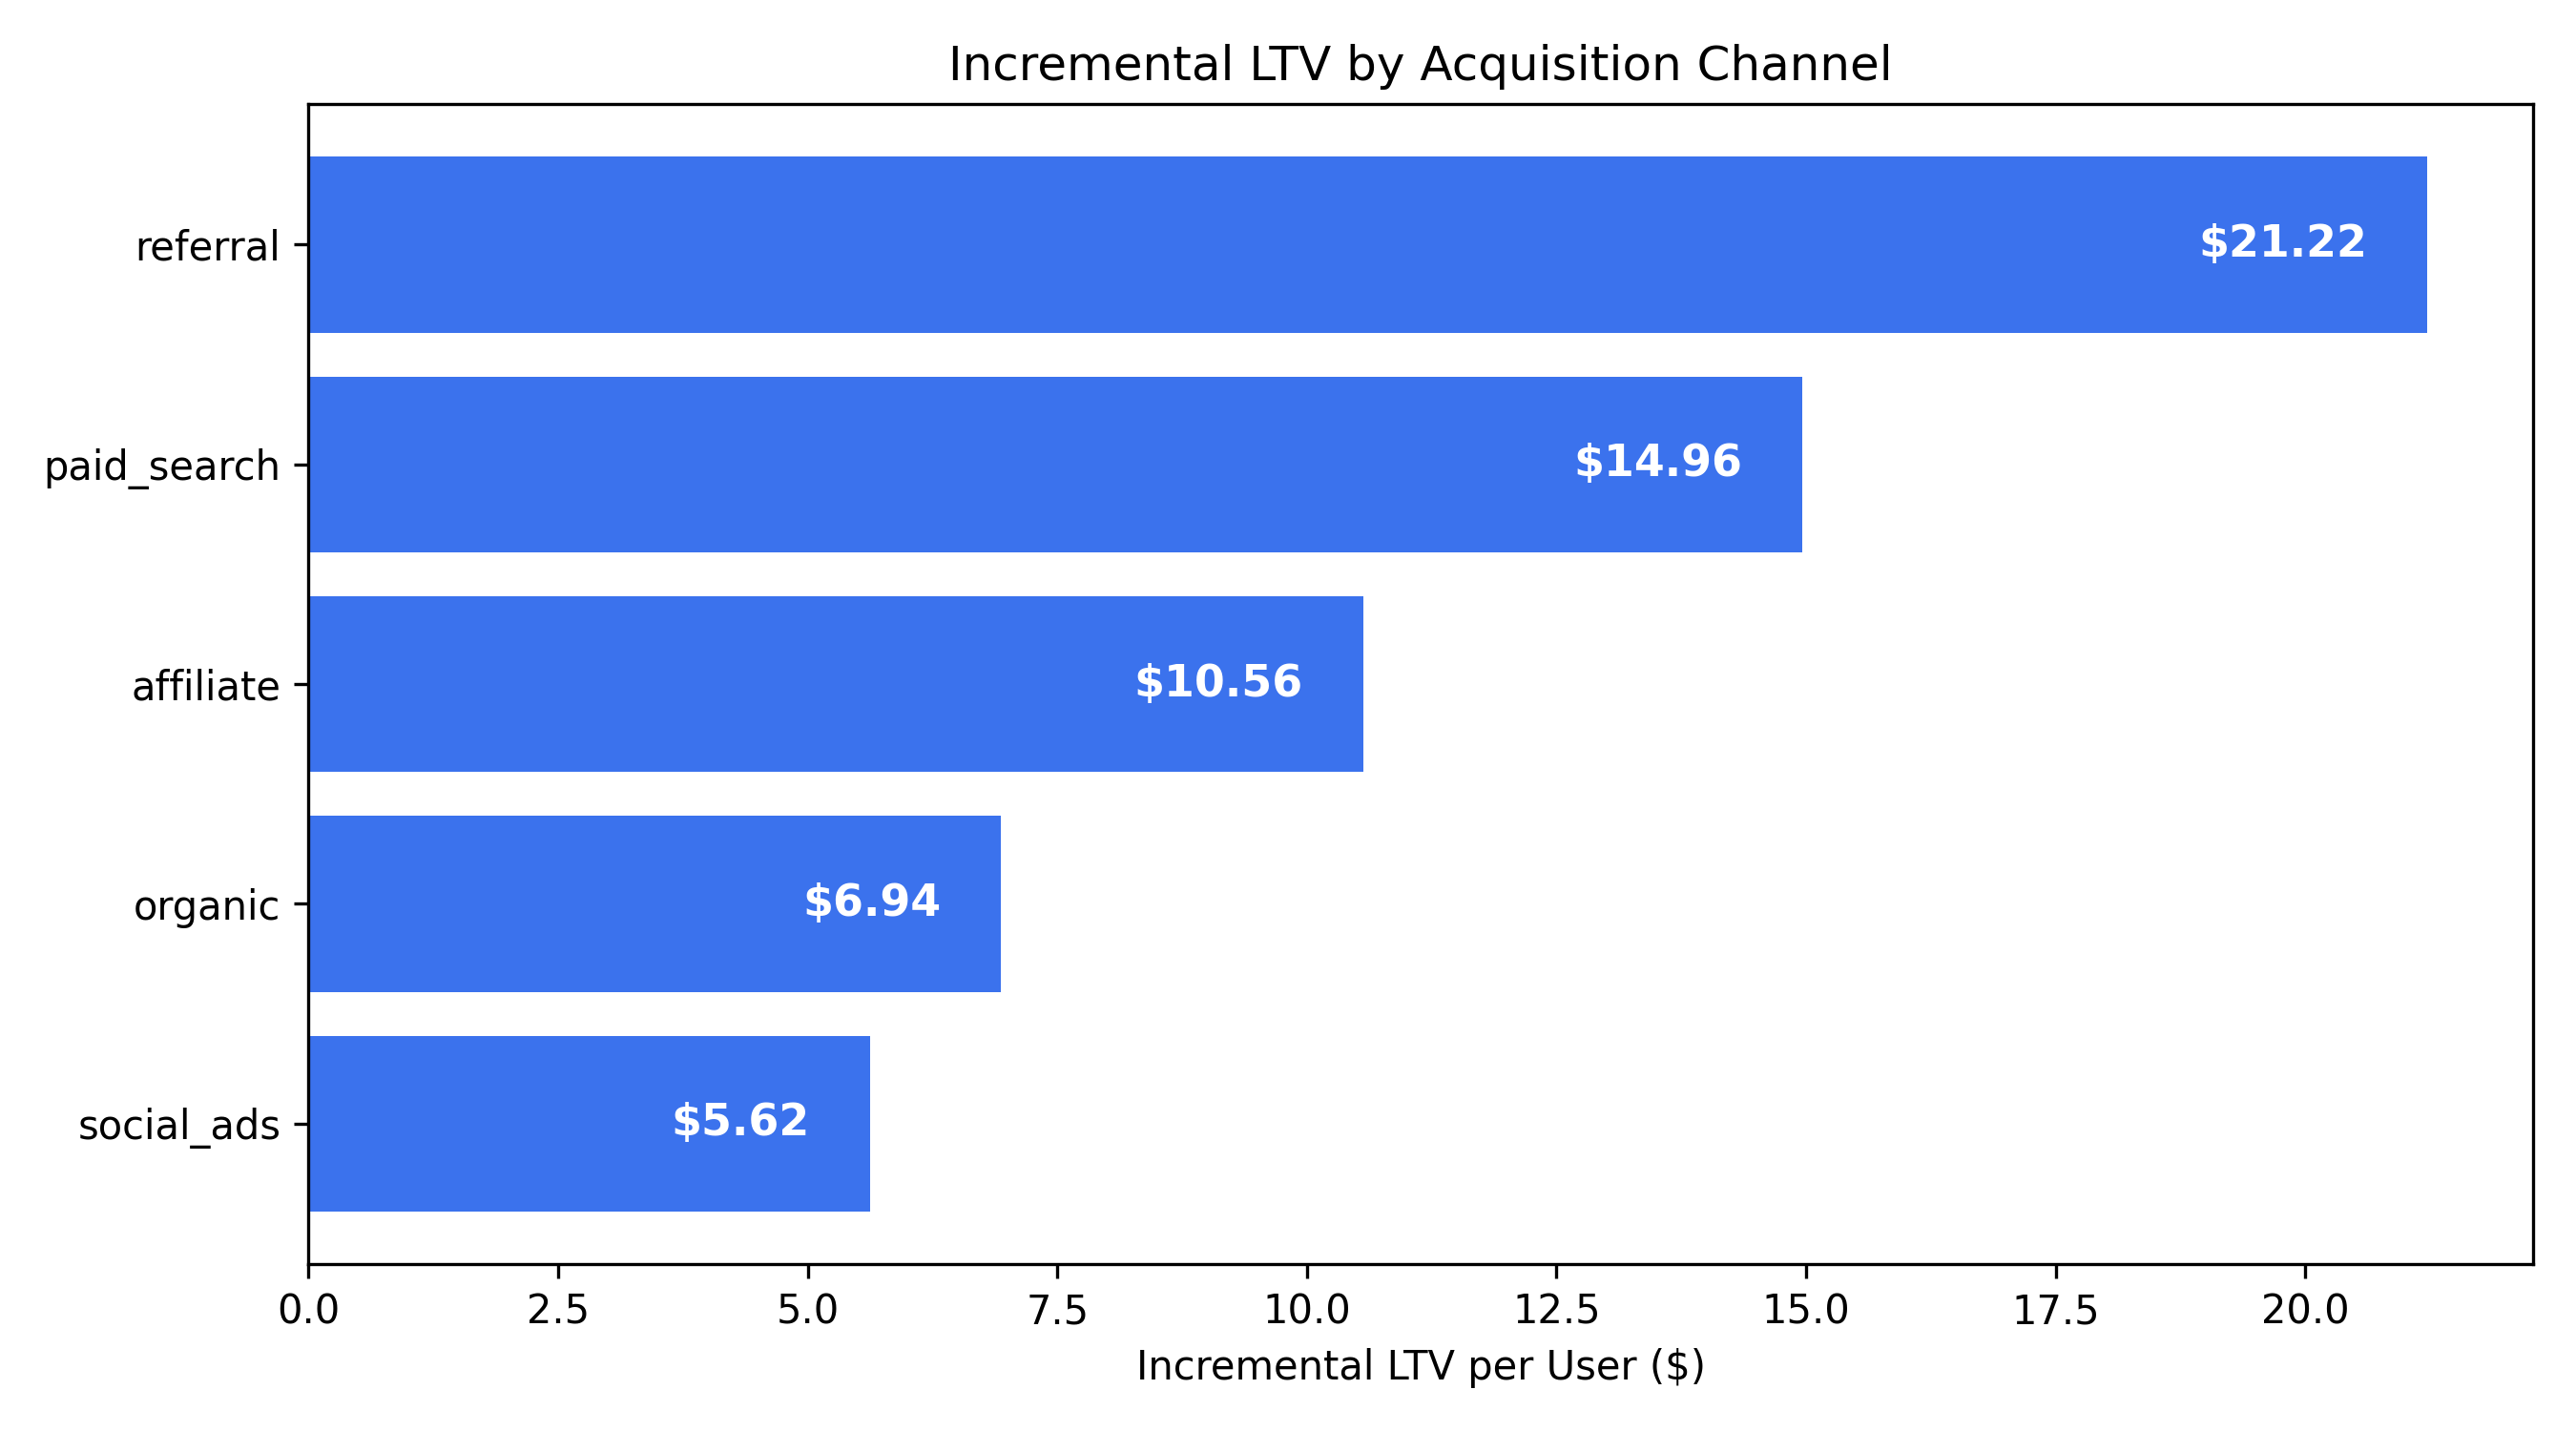
Takeaway: ranking channels by incremental LTV produces a materially different
prioritization than ROI and explains past scaling failures.
Decision implication
Budget allocation based on ROI would have systematically
over-invested in channels with weak causal impact
while underfunding the channel that created the most durable value.